Art World
Thomas Galbraith’s TEFAF Presentation on Top Performing Artists: Part Three of Four
Can markets for specific artists be manipulated?

Can markets for specific artists be manipulated?
Thomas Galbraith
 ShareShare This Article
In part one and part two of my presentation, I discussed top performing artists in terms of sales volume and sales value, and explained the artnet Index methodology. This week, I will discuss the markets for specific artists, and how these markets can be manipulated.The data below is derived from historical sales. Market information can be very useful, but we still don’t have explanations of causality. Why do these top artists perform better than their contemporaries?
Top Six Artists by ROI in 2002 to 2012
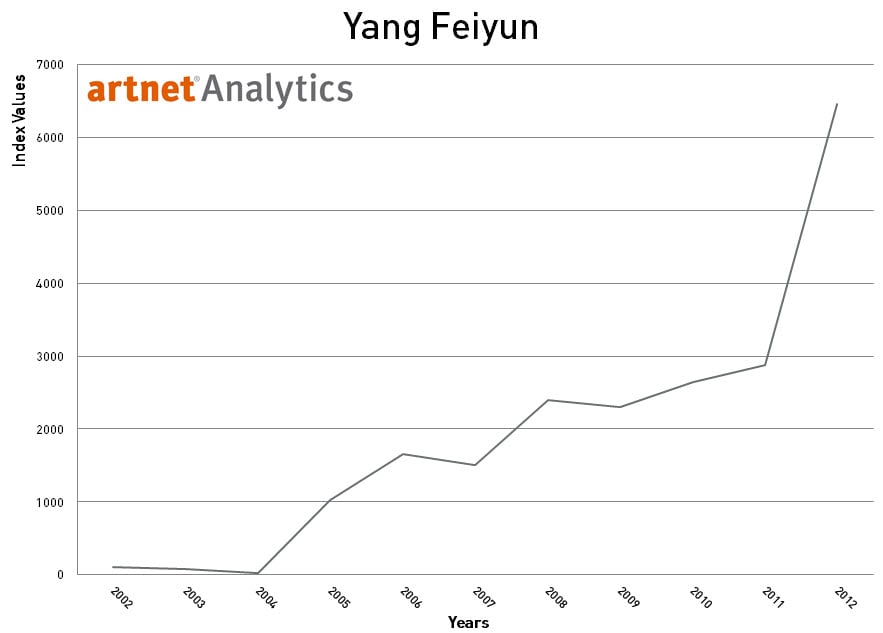
1. Yang Feiyun
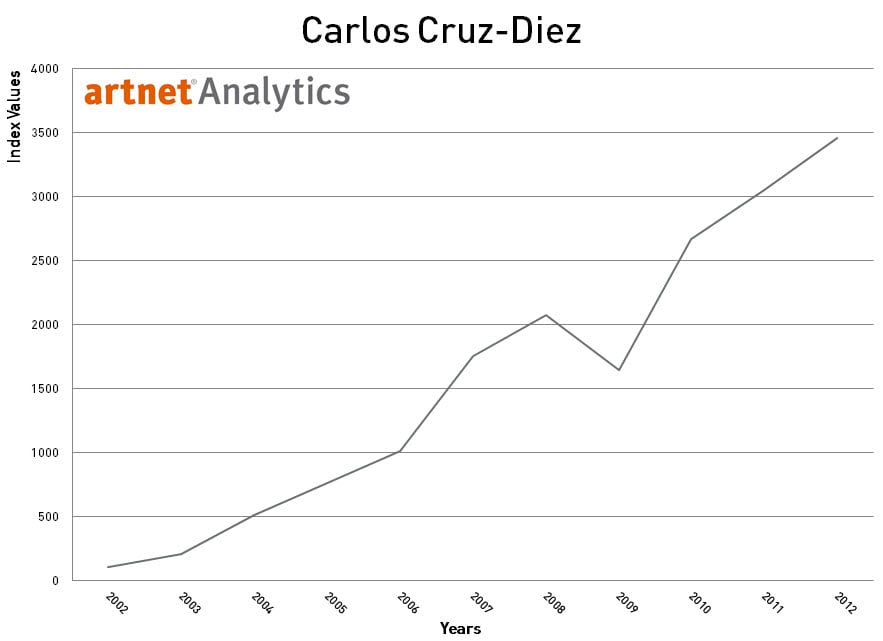
2. Carlos Cruz–Diez
3. Christopher Wool
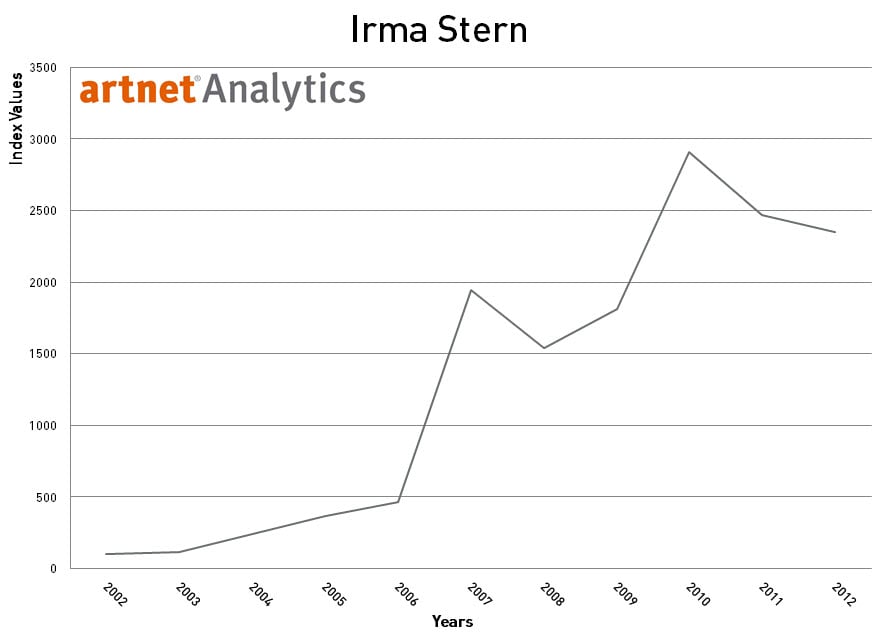
4. Irma Stern
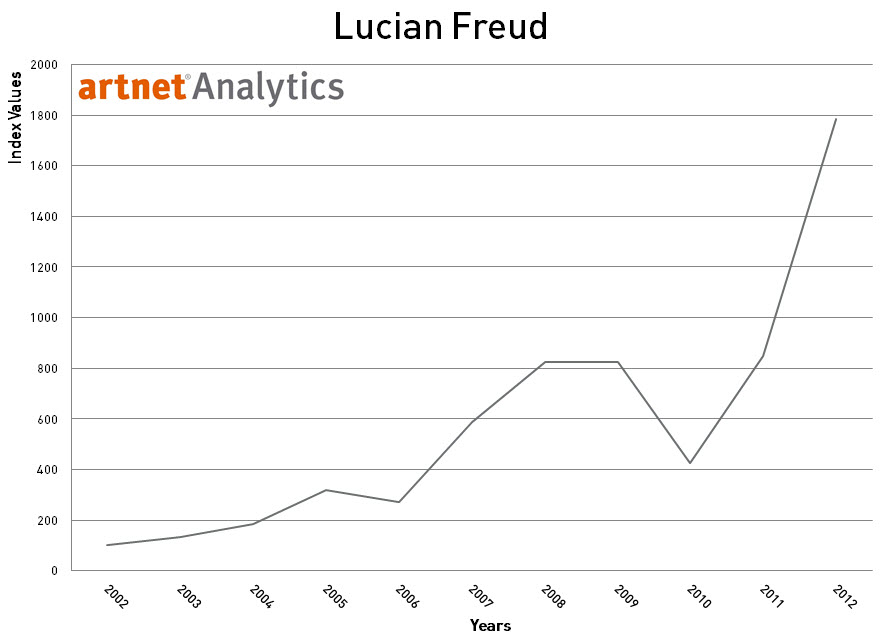
5. Lucian Freud
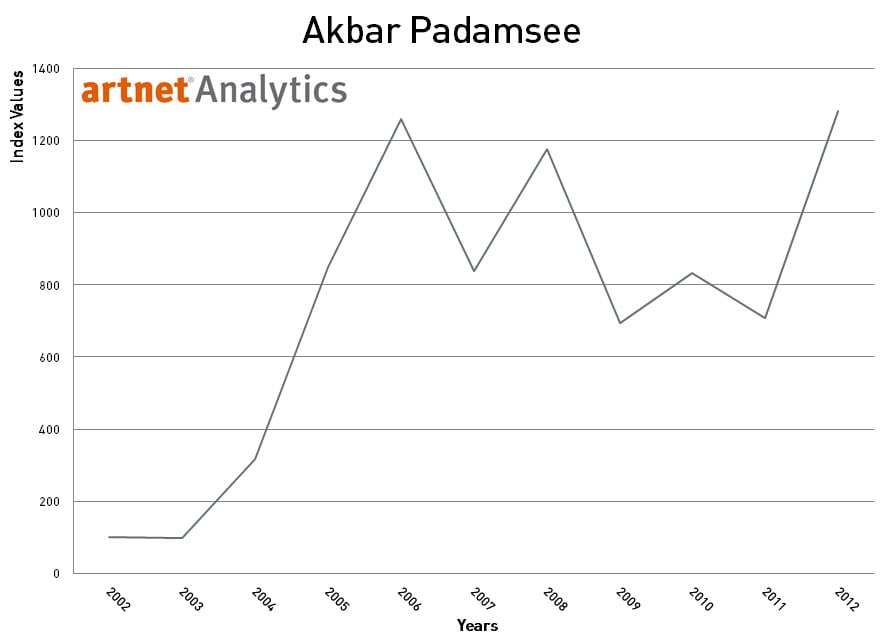
6. Akbar Padamsee
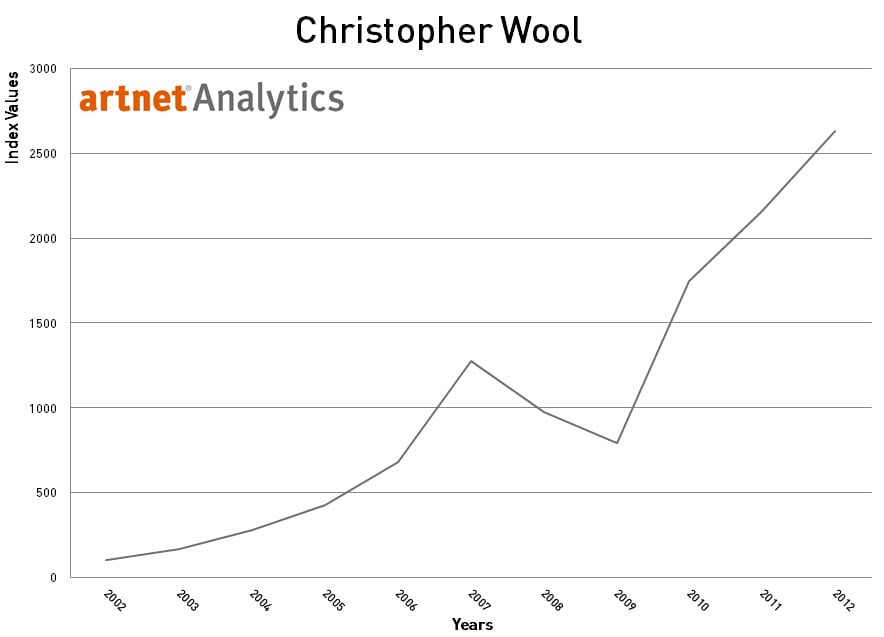
The art market remains under regulated and ripe for manipulation, and so you may wonder how to navigate these murky waters when your objective is to make a sound investment. When you’re looking to invest, a good place to start is with these top performing artists, especially when your fellow collectors have sizable fortunes dedicated to keeping the markets for these artists alive. Essentially, there comes a point when the sheer volume of money invested by a savvy group almost guarantees sustainability, if not continued success, for a particular artist’s market. Some familiar names, such as Mugrabi, Nahmad, and Gagosian, can be defined as “market markers.” Despite all of the anecdotal evidence, it is difficult to conclude what has an effect in the market, in large part because the market itself is a colluder. Usual indicators do help to a degree. For instance, we would expect artificially supported markets to not see consistent declines relative to the rest of the market, due to invested parties propping up sales. This should be most prevalent at the top end of the market, where the larger players buy. To demonstrate this we can examine three artists from different levels of the market: one whose market is supported, one whose market is in the stages of becoming supported, and one who appears to have lost ground, perhaps due to never having been supported in the first place.
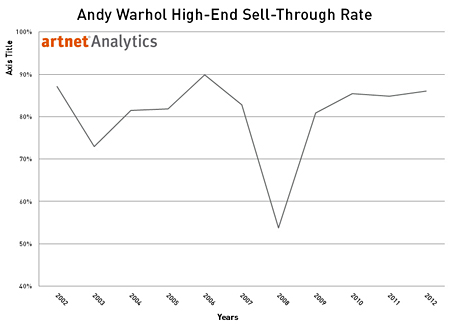
The top 30% by value of Andy Warhol lots over the past 10 years had an average sell through rate of 79.5%, and only dipped down to 53.8% in 2008. The 10 year average for lots that sold below the low estimate is 8.5%. This peaked at 25% in 2008, and promptly rebounded to a healthy 6.8% in 2009, as collectors worked to protect their investments.
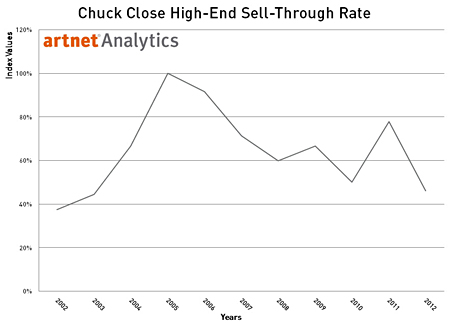
Meanwhile other unsupported artists, such as Chuck Close, saw larger decreases in sell through rates over time, with a peak in 2006 of 91.7% falling to a low of 46.2% in 2012, and an average of 11.6% of lots selling below the low estimate over 10 years. The indication here is that though Close’s market saw a significant improvement in the mid–2000s, the subsequent decrease, for whatever reason, was not buoyed by interested collectors looking to ensure, or regulate, the artist’s market, as was the case with Warhol.

Gerhard Richter finds himself in the middle of Warhol and Close, with supporting figures that indicate his market is strengthening. He has an even higher average sell through rate than Warhol over 10 years, at 84.8%, and only 9% of his lots sold have gone for below the low estimate. This would appear to indicate that while Warhol has reached a plateau of sorts, Richter is still a market collectors are actively seeking out. His performance, both by sell through rate and ROI over 2008, is enviable. As indicated before, there are footnotes to these conclusions; certain works by an artist will perform better than others, private sales are a relative unknown, and auction estimates are not always as fixed as they perhaps should be—prices can be amended or worse hidden completely. Lots can be withdrawn for unknown reasons, and reserves can and often are dropped. Ultimately, when properly handled, the art market can be very accommodating and flexible, much more so than the more regulated financial markets. While financial markets have regulating bodies and government oversight, such as the New York Fed, the SEC, and FSA, the art market has no set standard. Various trading tricks that are prohibited in the financial system are perfectly legal in the art market. As a result, the markets for these top artists are relatively easy to identify, and with the right systems and money in place, easy to manipulate.
To learn more about the artnet Index generation system and the calculation involved, read the complete artnet Indices White Paper. Create your own Analytics Report.