Galleries
How White Are New York’s Cultural Organizations?
Millennials are changing the numbers, but not fast enough.
Courtesy of Patrick McMullan.
Millennials are changing the numbers, but not fast enough.
Ben Davis
 ShareShare This Article
Even before Tom Finkelpearl became head of mayor Bill De Blasio’s Department of Cultural Affairs (DCLA), he had already developed a national reputation for the rare seriousness with which he had pursued community outreach as head of the Queens Museum of Art. Thus, one of his first, much-heralded initiatives after taking the reins was to initiate a study of the racial, ethnic, and gender makeup of New York City cultural organizations.
New York is a “majority minority” city. Its cultural institutions do not reflect this fact. That’s not exactly news, but astoundingly no hard data existed on the subject. After a year of gestation, the results of Finkelpearl’s initiative were officially unveiled yesterday, in the form of the 43-page study, “Diversity in the New York City Department Cultural Affairs Community.”
The survey was designed by research firm Ithaka S+R. “The final data set included 48,280 total records representing staff, board, and volunteers at various institution types and sizes. 36,441 of records represent paid staff,” according to authors Roger C. Schonfeld and Liam Sweeney. “Fifty percent of the organizations have fewer than 10 employees representing 6% of the total staff. On the other side of the spectrum, four organizations with over 1,000 employees compose 14% of the total employees in the dataset.”
Before getting into the meat of the report findings, it bears mentioning that such surveys inherently force not-at-all clear-cut things like gender and racial identity into boxes that don’t reflect lived complexity, a fact the authors acknowledge (“Quantifying diversity in labor markets is an inherently fraught pursuit,” they admit at the top). I also will note in passing that the anodyne language of “diversity” is itself subject to very important critique, as making institutionalized discrimination sound like a weather condition (“our forecast: a 60 percent chance of white people”).
In any case, the mere fact that such data did not even exist before to criticize shows that it is useful despite all the conceptual difficulties. And to my eye the resulting report is helpful, slicing and dicing its data to make some judicious but cutting observations about who does, and doesn’t, have a voice in the city’s cultural life.
The results have already inspired some motion. The Wall Street Journal reports that the city has responded by promising “$2 million in grants for development and training of theater professionals, with a focus on underrepresented groups, and a $1 million commitment to the city’s Cultural Institutions Group to support diversity efforts.”
Read the whole thing if you can. But below I’ll offer what I think are some of the most important takeaways. (You’ll notice the numbered graphs, which I’ve swiped from the report, are out of order, because I am remixing the report for the purposes of my own gloss; again, go read the whole thing.)
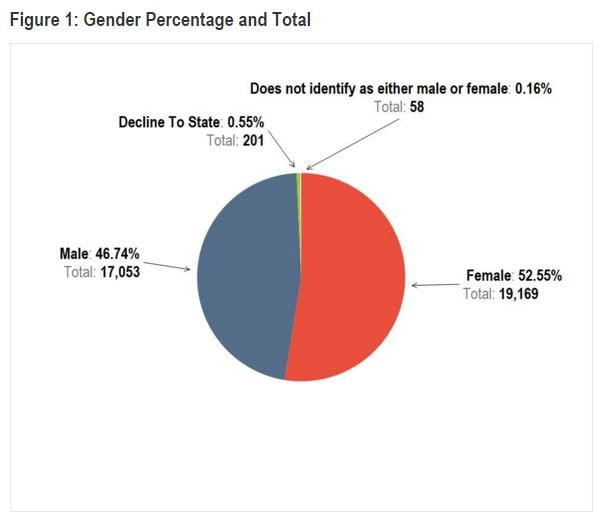
1: Gender Makeup
In terms of gender makeup, the cultural sector is about 53 percent female and 47 percent male—almost exactly the demographics of the city they represent.
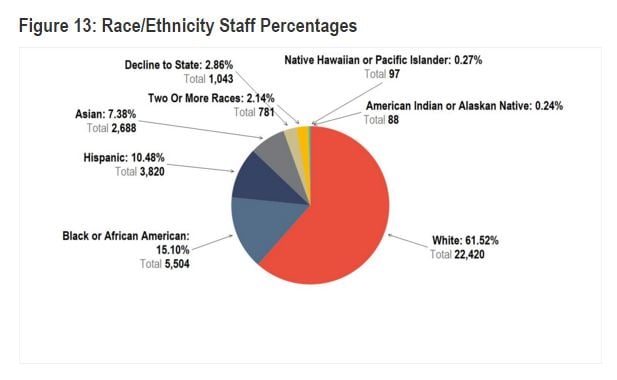
Things are not quite so representative, though, when it comes to race and ethnicity: “White non-Hispanic staff are 17 percentage point above the average population for New York City, based on the 2010 census.”
It’s worth comparing these two facts about New York art institutions with another report, coincidentally also released this week, about the publishing industry, which found it to be 78 percent female and 79 percent white.
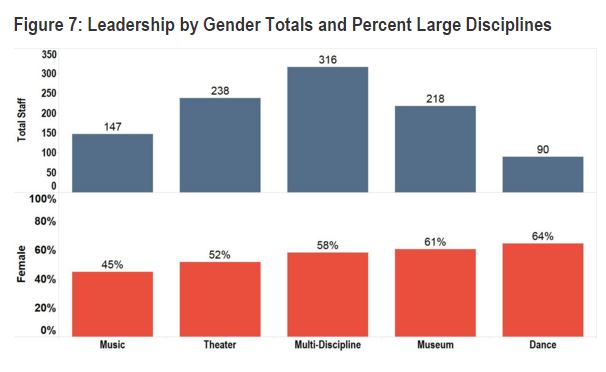
2: Female Leadership
The presence of women in support positions within the arts goes back a long way; Lucy Lippard used to talk about how women were accepted as helpers within the art world, but not as creators or leaders. The DCLA survey finds, however, that in 2015, women were slightly better represented the higher up the ranks you went.
Indeed, “Leadership” roles were 57 percent female overall, with the “Museum” sector faring slightly better than other sectors like “Music” and “Theater.” Sixty-one percent of “Leadership” roles—of which there are evidently 218—were reported to be held by women.
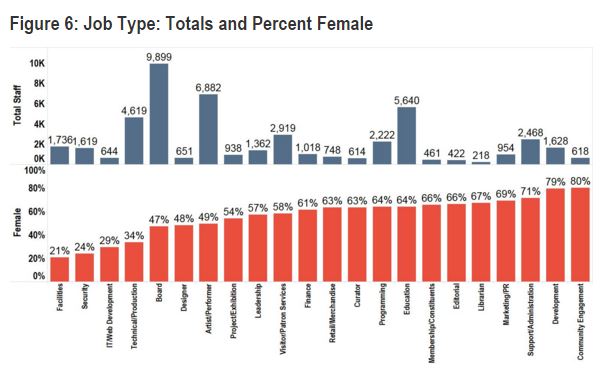
Overall, only four categories of job in the Cultural Sector skew heavily male. They are: Facilities, Security, IT/Web, and Technical/Production. Everything else is almost at gender parity or well above.
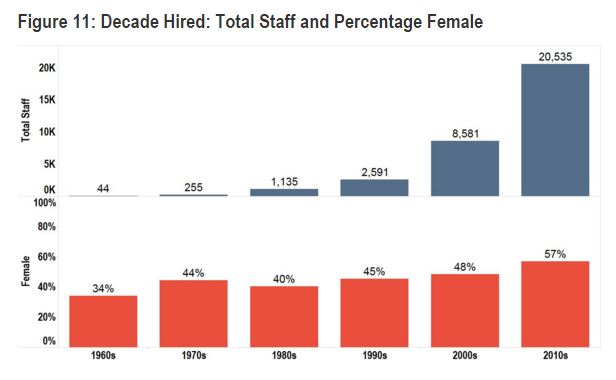
3: Recent Change
If this fact doesn’t match perception—there has been no shortage of discussion, of late, of continued gender bias at various levels in art—it may be worth considering that this is because changes have been relatively recent.
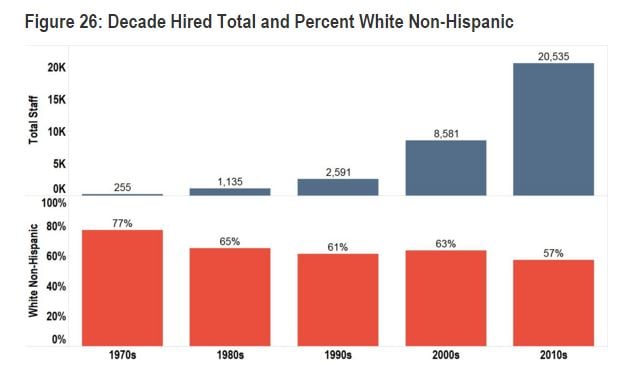
Since this is the first and only report on this subject, it is impossible to look at long-term trends. But the authors break down the numbers by date-hired and date born of the workers. This makes it look as if the really significant breakthroughs for women have been in the very recent past: “The majority of staff currently working at DCLA funded cultural organizations were hired in the last 6 years. That group is also the most female, 57%.”
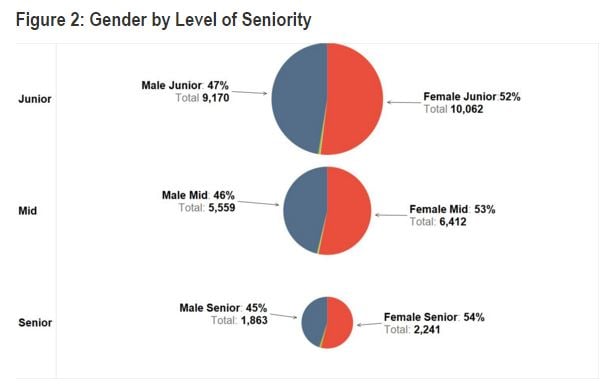
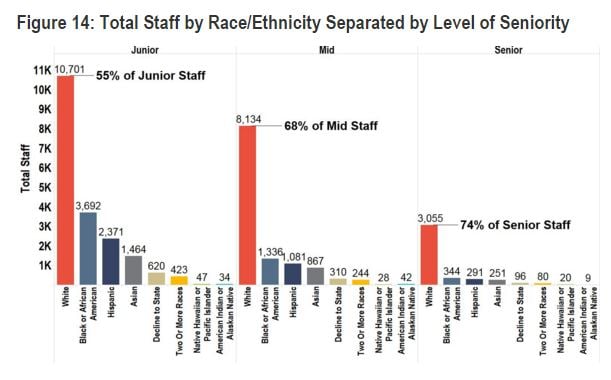
4: Junior vs. Senior Staff
When it comes to the data on Race/Ethnicity, the study confirms everything you suspect or fear.
It’s not just that “non-Hispanic whites” are over-represented; it’s that (unlike in the case of gender), the higher up the ladder you climb, the less representative things get. “Junior Staff” in DCLA institutions is 55 percent white non-Hispanic. By the time you get up to “Senior Staff,” it becomes 74 percent.
5: Follow the Money
“Analyzing staff diversity by budget reveals several clear patterns,” the report says. “As an organization’s budget increases so does its percent of white non-Hispanic employees.”
Further: “[O]rganizations with less than $250,000 dollar budgets hire on average 10 percentage points more minority employees than organizations with over $10 million budgets.” Which is a big deal, since the biggest organizations are also the biggest employers (Remember: “four organizations with over 1,000 employees compose 14% of the total employees in the dataset”).
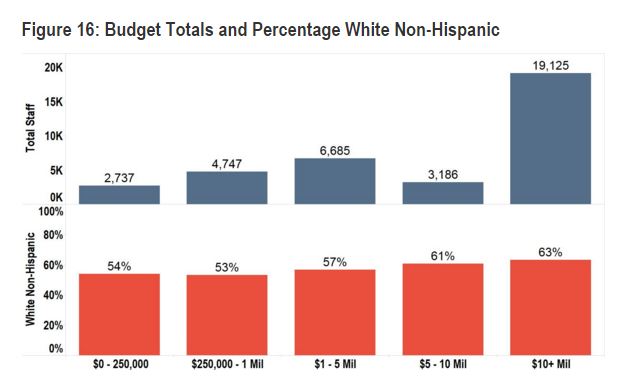
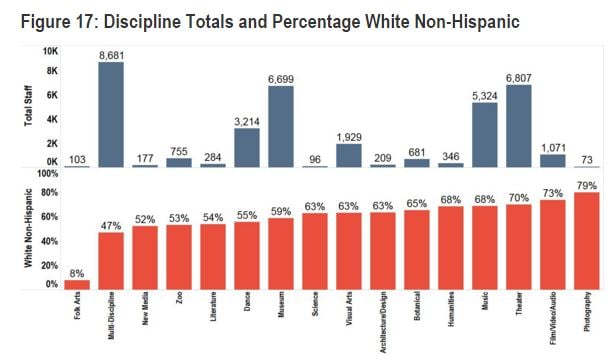
Breaking things down by sub-group, incidentally, the report tells us that New York’s “Museums” are 59 percent “white non-Hispanic,” while other assorted DCLA-funded non-museum “Visual Arts” orgs are 63 percent.
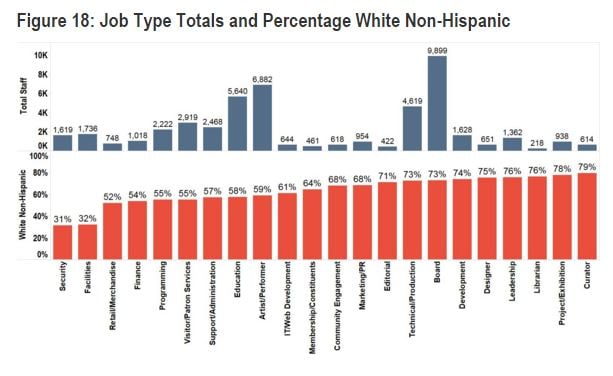
6: Worst Offenders
A particularly striking chart shows how each job type within the cultural field looks. The category of “Artist/Performer” clocks in at 59 percent “white non-Hispanic.”
The whitest job of them all is “Curator.”
7: Lack of Leadership
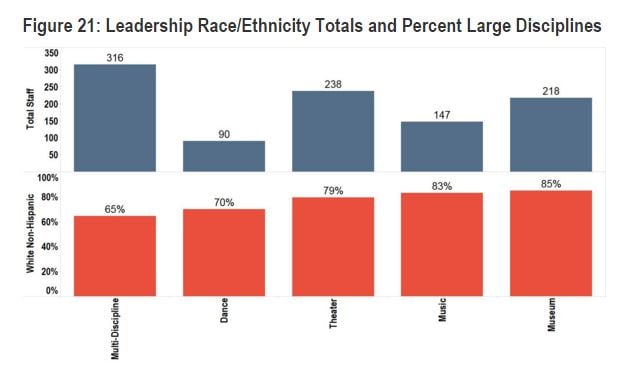
Both leadership positions and board roles are very, very white: “Black or African American staff make up 9% of leadership staff. Hispanic staff are 5% and Asian staff are 4%.” About the same totals hold for the makeup of boards.
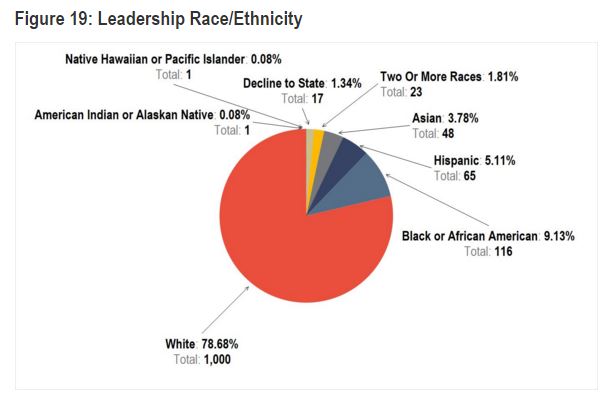
The “Museum” field, incidentally, has the whitest leadership group of any of the various cultural fields. Of its 218 “leaders,” 85 percent check the “white non-Hispanic” box.
8: Hopeful Millennials
If there is a positive note to sound here, it is that there does appear to be some creaking change.
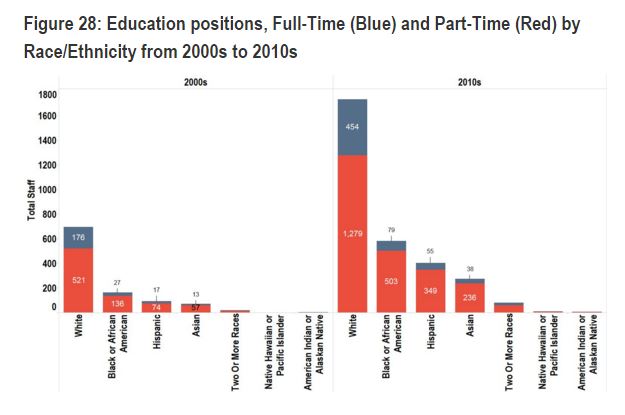
Crunching the diversity totals against date born/date hired, the survey finds, “the majority of employees working for DCLA are between 25 and 35, have been recently hired, and are the most racially diverse age group in DCLA.”
However, the report seems to locate this surge specifically in education departments, and notes that “the majority of these positions across race and decade are part-time,” which would seem to represent its own form of bias. (It adds in a parenthetical that the Museum community is a partial exception, “where education positions are closer to 50% part-time, 50% full-time.”)
9: What Does Diversity Mean?
Close to 70 percent of the organizations that returned the survey either “agreed” or “strongly agreed” with the statement “I feel my organization is diverse.” What to make of that fact, which would seem to contradict reality as depicted in the study?
Perhaps this reflects the fact that the smaller, and therefore more numerous organizations actually are a bit more diverse. Or perhaps it simply reflects a gap in self-reflection that this study can help correct.
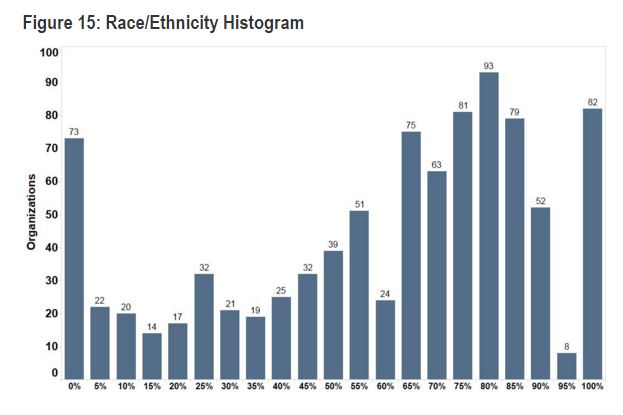
The graph below illustrates the actual composition of NYC’s cultural orgs, with the horizontal axis representing the percentage of staff that is “white non-Hispanic,” and the vertical axis representing the number of organizations that fit the criteria (so that, for instance, the bar on the extreme right indicates that there are 82 organizations that are all-white). By my count, it suggests that over half of all the institutions have staffs that are 70 percent or more white:
10: Ideas for Change
The report also concludes with some anonymous testimony from organizations on initiatives that have made a difference in hiring practices. These do seem to indicate that a specific focus on the problem can help: consciously cultivating partnerships with schools and multicultural organizations, for instance, or making sure to post openings to job sites that broaden the pool of applicants (DiversityJobs.com is mentioned), including when looking for interns, since new hires often come out of the intern pool.
I’m skeptical about this last as a cure, because of the well-known biases of “intern culture,” which brings me to the final point…
11: Class Matters
“Socioeconomic status” was ranked as an important form of diversity by the surveyed organizations, but specifically was not part of the scope of this survey, confirming my theory that class is a true elephant in the museum. Its influence may, indeed, help explain some of the other, disheartening findings of the study. The authors relay this quote from an unnamed cultural leader:
We operate on a shoestring budget, and have trouble paying competitive salaries. As a result, job applicants are usually those who come from more privileged backgrounds and can afford to work for little money. This is our primary barrier to increasing staff diversity.
Is class the last taboo? Actually, maybe not. After noting that the survey included a field for “disability,” but acknowledging the difficulties of tracking such data, the authors of “Diversity in the New York City Department of Cultural Affairs Community” conclude:
We were nonetheless surprised to receive nearly no records of anyone with a disability out of the 48,280 employees, volunteers and board members who were recorded.