The Gray Market
New York’s New Art Map: What 9 Years of Data About Gallery Openings Reveal About the Shifting Geography of Cool
Which neighborhoods are rising—and which have dramatically fallen from grace (with charts!).

Which neighborhoods are rising—and which have dramatically fallen from grace (with charts!).
Tim Schneider
 ShareShare This Article
Every week, Artnet News brings you The Gray Market. The column decodes important stories from the previous week—and offers unparalleled insight into the inner workings of the art industry in the process.
This week, redrawing the map…
Ask almost anyone familiar with New York’s gallery scene where the heat has been concentrating lately, and they won’t hesitate before saying Tribeca. Although a handful of dealers (such as Postmasters and Carriage Trade) and nonprofits (such as Artists Space) originally set up shop in the neighborhood roughly a decade ago, it remained a relatively niche location among the exhibiting crowd for years afterward. Then, seemingly overnight, it metamorphosed into the neighborhood that all but the bluest of the blue-chip dealers decided they needed to move or expand to next. In fact, after the illustrious Marian Goodman Gallery recently announced plans to relocate to Tribeca in 2024, all levels of the hierarchy seem to want in.
Every dedicated art pro and art fan seems to understand this on an intuitive level. But has Tribeca really grown as much and as fast as the consensus opinion holds? If so, to what extent is Tribeca actually poaching other areas’ best and brightest exhibitors? And has the laser focus on this one zone of activity created a blind spot for other vital ways that the topography of the global art world’s capital has been reshaped in recent years?
To get the clearest, most holistic reading of how the tectonic plates of New York’s gallery landscape are shifting, I reached out to See Saw, the indispensable app centralizing listings, locations, and recommendations for exhibitions throughout New York City and other major art metropolises. See Saw’s cofounders, siblings Ellen and Patrick Swieskowski, were willing to work with me to pull data from the app’s extensive archives of gallery exhibitions for the past nine years (the longest stretch for which the company considers its listings comprehensive). They then sliced that data finer than the app normally does and fed it to me for analysis and data visualization, all to create a kind of seismograph of the New York art scene’s transformation across neighborhoods over most of the past decade.
I’ll save many of the specifics for the methodology section at the end of this post, but a few key points deserve mention here to set up the charts and commentary.
First, See Saw normally parses New York into just four sections: Chelsea, Downtown, Uptown, and Brooklyn/Queens. But since “Downtown” is too broad a designation to let us peer into the evolution of Tribeca and other particular pockets of lower Manhattan, I asked the Swieskowskis to break it into nine distinct neighborhoods: the Bowery, Chinatown, the East Village, the Lower East Side, NoHo, SoHo, Tribeca, Union Square, and the West Village.
New Yorkers will probably never stop arguing about the dividing lines between some of these areas, so for the sake of transparency, below is a color-coded map showing exactly how See Saw carved up downtown Manhattan.
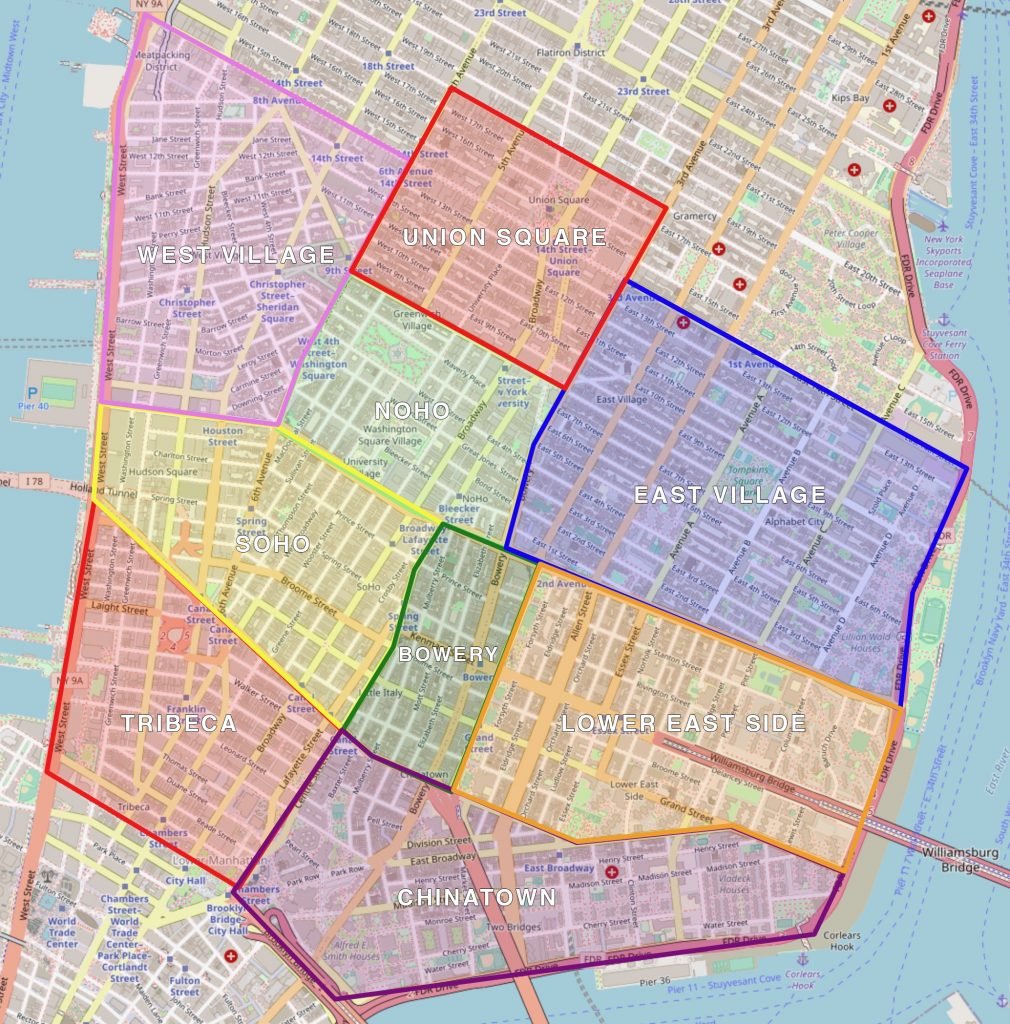
Color-coded map of downtown New York gallery neighborhoods as of March 1, 2023. Illustration by See Saw.
With these borders defined, See Saw’s cofounders generated quarterly lists of gallery activity in each neighborhood, dating from the second quarter of 2014 through March 1, 2023, allowing us to quantify and chart how the map transformed over the short, medium, and long term. (Union Square and the West Village ended up having a negligible amount of activity, meaning we can wave goodbye to them here.)
So, how does it all add up? The sheer amount of neighborhoods in play makes it hard to comprehend much of value from a macro view of the data (at least, not without feeling like you’re exerting enough mental energy to telekinetically move a glass of water across the nearest flat surface). But for you maximalists out there, the full picture is below. (Please just note that it’s a quirk of my data visualization software that gallery activity in each quarter is designed strictly by the opening date of said quarter, e.g. “4/1/2014” stands in for the entire second quarter of 2014.)
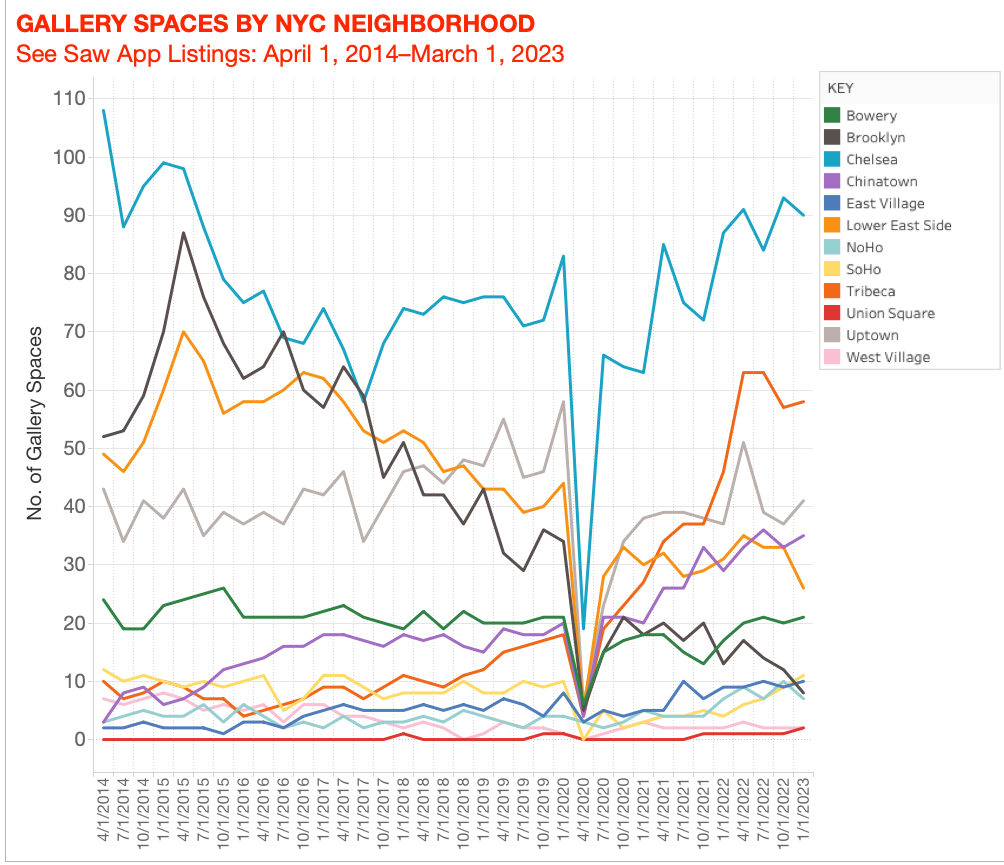
Data courtesy of See Saw. Data visualization by Tim Schneider.
Even in this hectic chart, two points manage to stand out:
To get more out of the data, I’ve broken out key segments of the pan-neighborhood chart above into three focused comparisons below. Sorting through them one by one allows us to better see and understand some of the most important ways in which New York’s gallery ecosystem has changed since early 2014.
Let’s start by examining Tribeca’s emergence from relative anonymity in Manhattan’s gallery scene…
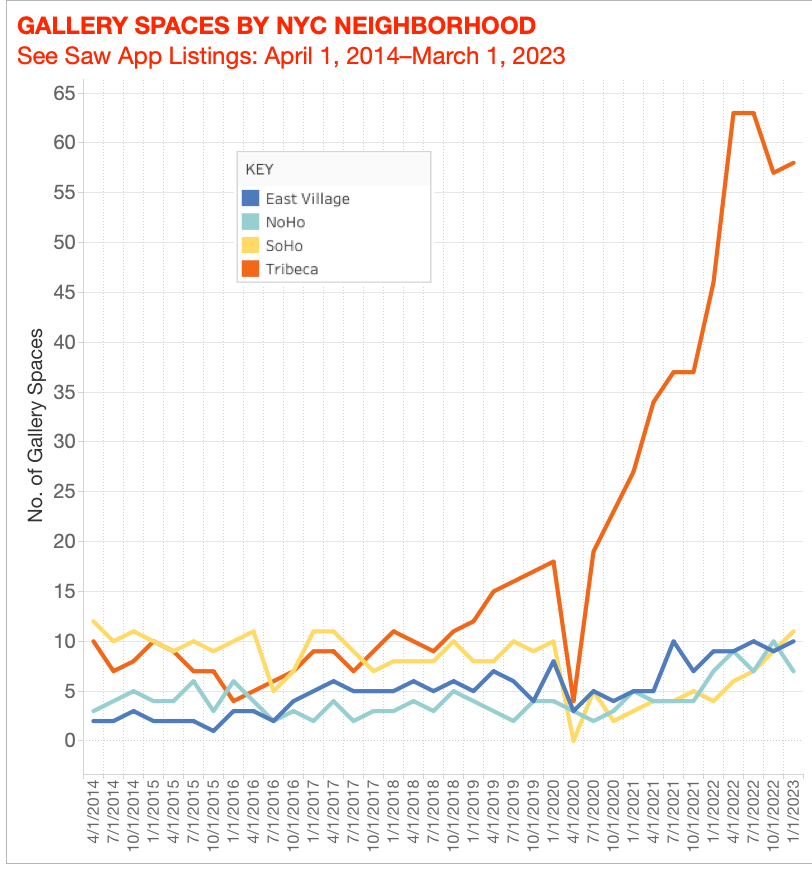
Data courtesy of See Saw. Data visualization by Tim Schneider.
Again, it’s no searing insight that much of the momentum in New York’s gallery-neighborhood derby has been concentrating on Tribeca. But the chart above comparing Tribeca to SoHo, NoHo, and the East Village shows that this shift didn’t start to emerge until just before COVID struck, then accelerated rapidly after.
Now that we’ve seen how aggressively and how recently Tribeca pulled away from its longtime peers in the New York gallery scene, a different comp can help us even better appreciate the rare air it’s ascended to…
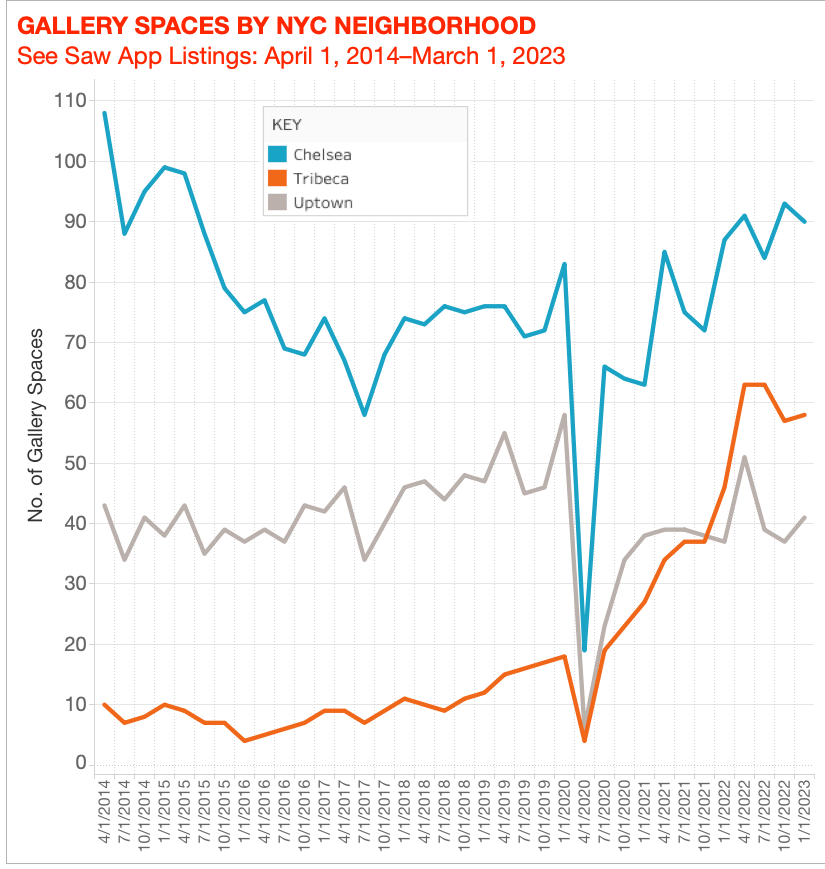
Data courtesy of See Saw. Data visualization by Tim Schneider.
The chart above strictly compares the three densest gallery neighborhoods in present-day New York: Chelsea, Tribeca, and Uptown. But even here, change is afoot…
As much as Tribeca has deserved its place at the center of the conversation about New York’s blue-chip gallery landscape, an important shift has been happening another tier down the prestige hierarchy, too.
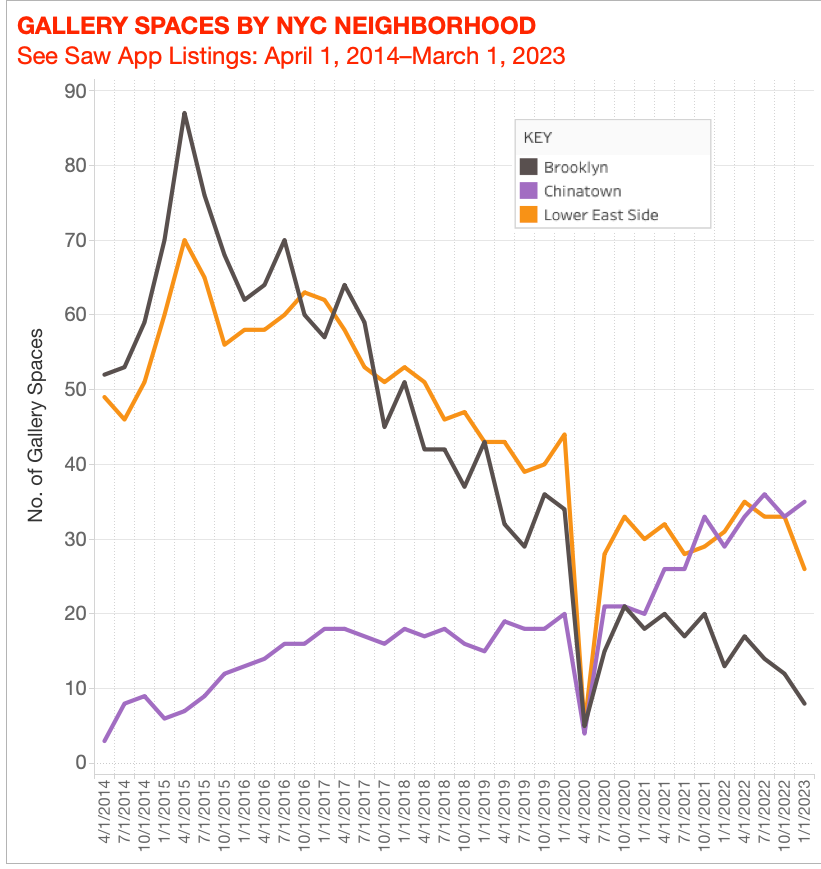
Data courtesy of See Saw. Data visualization by Tim Schneider.
The chart above tracks the three areas most hospitable to edgier, scrappier, and often more boundary-pushing gallery spaces since 2014: Brooklyn, Chinatown, and the Lower East Side. A changing of the guard has taken place here, too. It’s just happened much more quietly…
So, where does this leave us? And what does the future hold?
We already know that more galleries are preparing to put down roots in Tribeca in the months ahead. Aside from Marian Goodman, the list includes everyone from emerging New York and Los Angeles gallery Shrine, to more established market forces such as Alexander Gray Associates, Almine Rech, and Jack Shainman.
Still, it’s unlikely to me that Tribeca will ever unseat Chelsea for the top spot. That hunch is based on both the size of the latter’s lead and the size and accessibility of its actual real estate. Unlike in Chelsea’s sprawling storefront properties and multilevel mega-gallery headquarters, Tribeca just doesn’t seem to offer many opportunities for, say, Gagosian to stage a gargantuan dual-venue exhibition of Richard Serra steel sculptures, or for David Zwirner to re-present multiple colossal Felix Gonzalez-Torres works. As long as those type of exhibitions matter to the art world, Chelsea will maintain a massive advantage among apex dealers and their collectors. Which also creates a major incentive for dozens of other high-end dealers to cluster around them.
Still, even if Chelsea maintains its top dog status, that leaves plenty of galleries farther down the ziggurat of prestige to swap cheaper, trendier, harder-to-navigate spaces within Manhattan’s other neighborhoods, creating ebbs and flows in the art geography. Those other neighborhoods will keep cycling in and out of fashion among exhibitors based on real-estate trends and the larger financial picture, just as they always have—something Tribeca’s current ascent (and Brooklyn’s major decline) during the last almost-decade illustrates.
That’s all for this week. ‘Til next time, remember: there’s always more happening beneath the consensus opinion.
Notes on Methodology:
All data used in the above post comes courtesy of See Saw. The data shows quarterly gallery activity by neighborhood/borough in New York City, from the second quarter of 2014 through March 1, 2023. To be listed as “active” in any given quarter, a gallery space only needs to have staged one exhibition listed by See Saw at any point during that quarter. A “gallery space” is defined here as any physical space where an exhibition is programmed, regardless of whether the entity staging it is for-profit or nonprofit, or whether the space itself is a permanent location or a temporary pop-up venue. Data was sliced by quarter to best fit with the typical four-to-eight-week length of a gallery show in New York.
The geographical perimeters of each downtown Manhattan neighborhood in the sample are illustrated in the color-coded map accompanying the text. For clarity, “Tribeca” is defined here as the area whose northern boundary includes the south side of Canal Street, whose southern boundary includes Chambers Street, whose western boundary includes West Street, and whose eastern boundary includes Centre Street. It is important to note that the data counts the number of individual gallery spaces active during each quarter, not the number of individual gallery businesses operating those spaces. This means that, for example, if a given neighborhood’s gallery activity consisted entirely of two different for-profit dealers staging exhibitions in two different spaces each, the total number of gallery spaces active in said neighborhood within that quarter would be four.