Women's Place in the Art World
Methodology: How We Gathered and Analyzed Our Data on Women in the Art World
Here's how we gathered and analyzed the data that formed the backbone of our investigation.

Here's how we gathered and analyzed the data that formed the backbone of our investigation.
Julia Halperin &
Charlotte Burns
 ShareShare This Article
We teamed up with In Other Words to examine how the representation of female artists in museums and the market has evolved over the past decade. Below is a detailed breakdown of our approach.
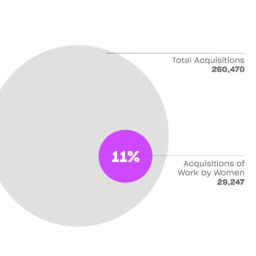
We gathered and examined data from 26 museums across the United States for the ten-year period between January 1, 2008 and December 31, 2018. We looked at the total number of works that entered the museums’ permanent collections and, within that, the total number of works by female artists (we included both purchases and donations of art but excluded promised gifts). We also counted solo exhibitions dedicated to the work of female artists and thematic group exhibitions featuring mostly work by female artists (51 percent or more).
We have a decade’s worth of acquisition and exhibition data for 25 museums, and seven years’ worth for one (the Crystal Bridges Museum of American Art in Bentonville, Arkansas, which opened in 2011).
We defined female as any artist who identifies herself as a woman. Artists who are nonbinary and do not self-identify as female were not included. We counted collectives or companies whose founding members were majority female as well as work designed by women but not necessarily manufactured by them. Unnamed or unknown artists who the museums believe are very likely to have been women were included in our study.
The vast majority of the information was provided by the institutions themselves and verified by our research team. This means the data reflects each museum’s distinct record-keeping practices. Some, for example, record print or photography portfolios as one object, while others count each individual page in the portfolio as a separate acquisition. In select cases where museums were unable to provide a full data set, we gathered the data manually (as was the case for the Museum of Modern Art).
We deliberately sought a mix of institutions in terms of their budget, focus, attendance, and location. The museums we examined are, in alphabetical order: the Baltimore Museum of Art; the Brooklyn Museum; the Cleveland Museum of Art; the Crystal Bridges Museum of American Art, Bentonville, Arkansas; the Dallas Museum of Art; the Dia Art Foundation, New York; the Getty Center, Los Angeles; the Solomon R. Guggenheim Museum, New York; the Hammer Museum, Los Angeles; the High Museum of Art, Atlanta; the Hirshhorn Museum and Sculpture Garden, Washington, DC; the Los Angeles County Museum of Art; the Metropolitan Museum of Art, New York; the Museum of Contemporary Art, Chicago; the Museum of Contemporary Art, Los Angeles; the Museum of Fine Arts, Houston; the Museum of Fine Arts, Boston; the Museum of Modern Art, New York; the Nasher Museum of Art at Duke University, Durham, North Carolina; the Nelson-Atkins Museum of Art, Kansas City; the Pennsylvania Academy of the Fine Arts, Philadelphia; the San Francisco Museum of Modern Art; the Seattle Art Museum; the Smithsonian American Art Museum in Washington, DC; the Studio Museum in Harlem, New York; and the Virginia Museum of Fine Arts in Richmond.
To better understand how these works entered into museums’ collections, we also gathered data from 17 of the participating museums about what proportion were gifts (53 percent) or purchases (21 percent). (The remainder was unknown, either because the museums were unclear or did not provide the data.)
To provide insight into the private market, we calculated the proportion of female artists represented at the Art Basel fairs in Basel, Hong Kong, and Miami, checking lists of artists on the fair’s website (2015–18) against our master list of more than 21,000 female artists’ names.
The museum data collection was overseen by Charlotte Burns. The process was executed by Julia Vennitti, and analysis performed by Maggie Jordan and Michael Klein, with data entry assistance from Madeline Barnabee. Resales were tracked and analyzed by Sotheby’s Mei Moses. Gallery data and art fair statistics were gathered by Charlotte Burns and Julia Vennitti.
The auction market data collection was overseen by Julia Halperin and Michaela Ben Yehuda and was provided by the artnet Price Database. It reflects auction results from more than 400 auction houses worldwide between January 1, 2008 and June 1, 2019. All sales prices are adjusted to include the buyer’s premium. Price data from previous years has not been adjusted for inflation. All results are logged in the currency native to the auction house where the sale took place, then converted to US dollars based on the exchange rate on the day of the sale.
Data visualizations were created by Beatriz Lozano.
We gathered data across a three-month period beginning in February 2019, and then spent four months interviewing more than 40 people—a mix of museum directors and curators, collectors, dealers, advisors, and academics—to document their reactions, insights, and context.
For more from this project, see our examination of women in museums; our examination of the women in the market; four case studies on museums making change; our investigation into maternity leave in the art world; visualizations of our findings; and art-world reactions to the data.