The Burns Halperin Report
Visualizing the Numbers: See Infographics Tracing Representation of Female and Black American Artists
See how representation in U.S. museums and the art market has evolved—and not evolved—in these data visualizations.

See how representation in U.S. museums and the art market has evolved—and not evolved—in these data visualizations.
Nehema Kariuki
 ShareShare This Article
![]()
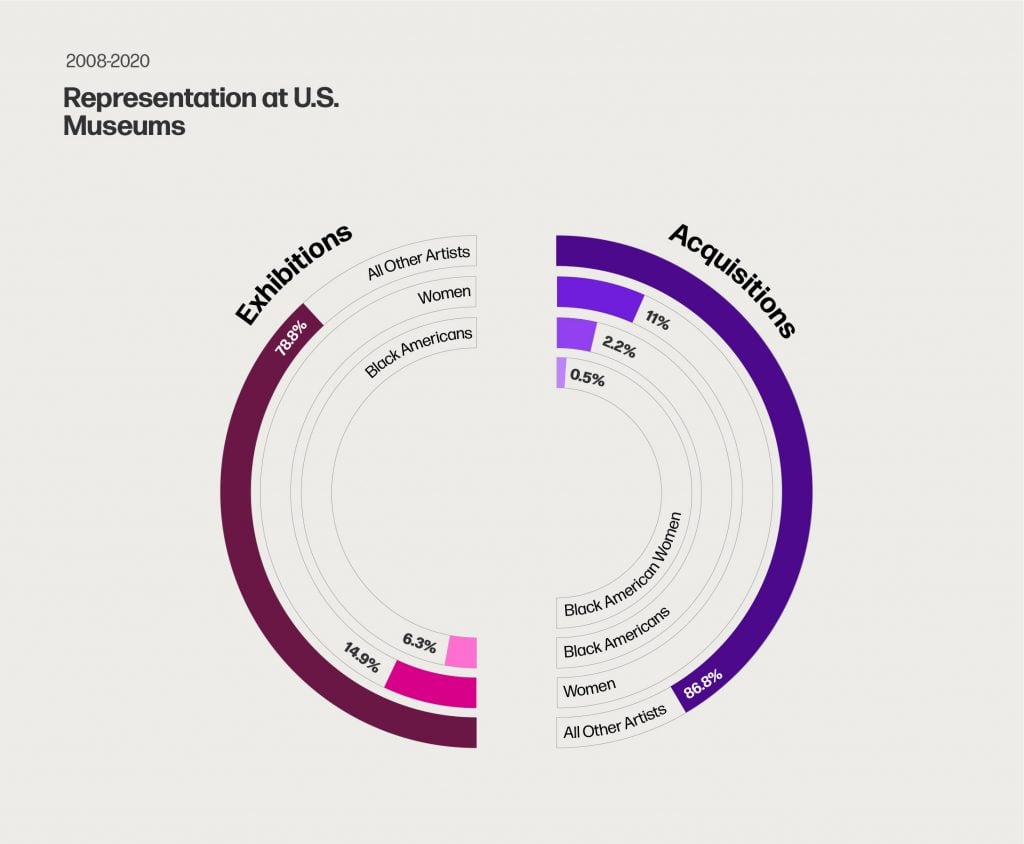
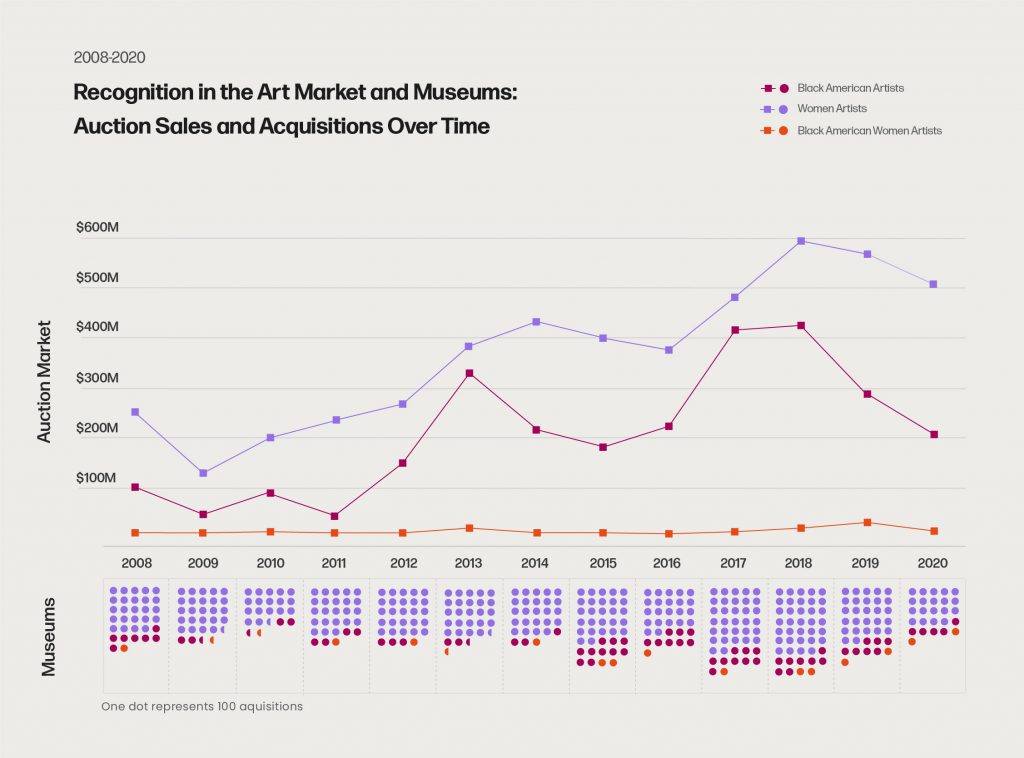
We examined representation in U.S. museums and the art market for work by Black American artists, female-identifying artists, and Black American female-identifying artists by tracing museum acquisitions (a total of almost 350,000 objects) and exhibitions (nearly 6,000) at 31 museums as well as auction results over more than a decade. See infographics breaking down our findings.
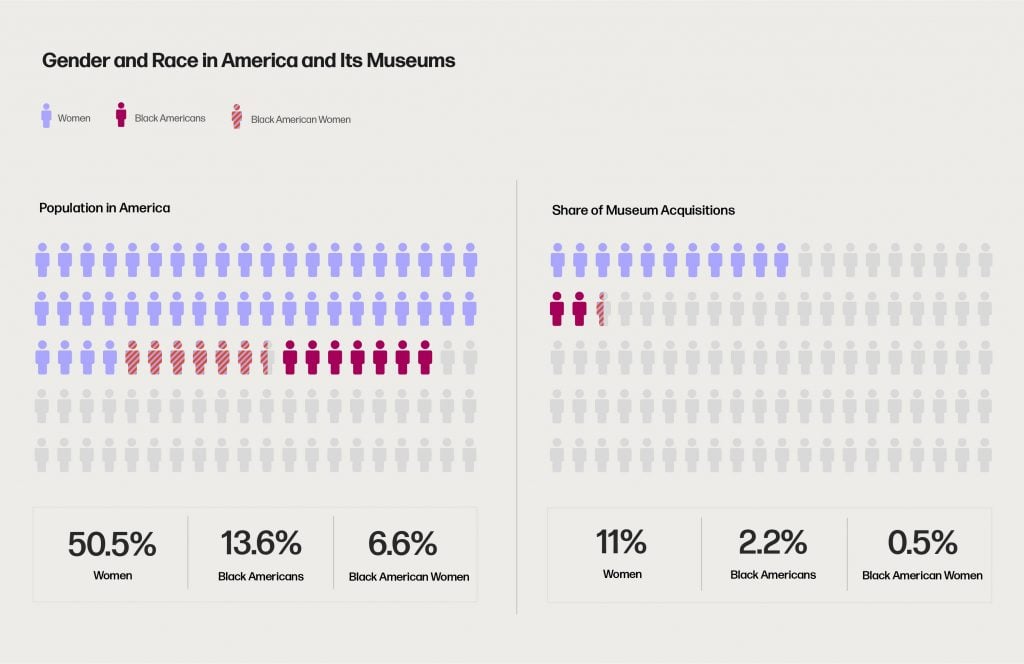
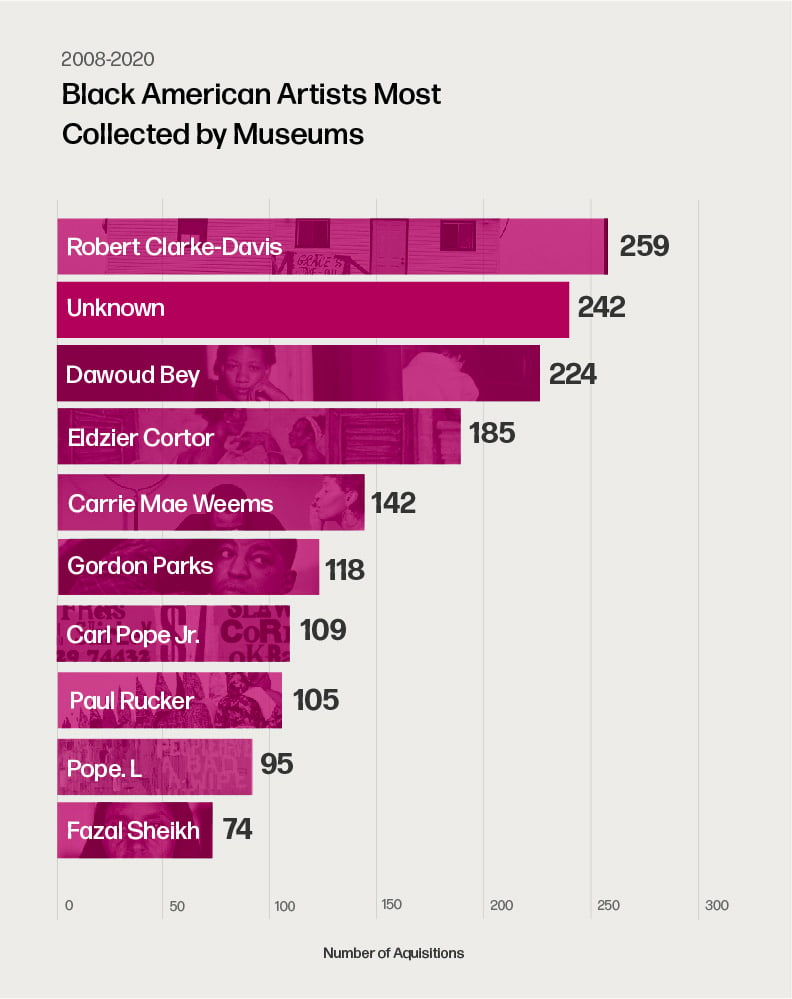
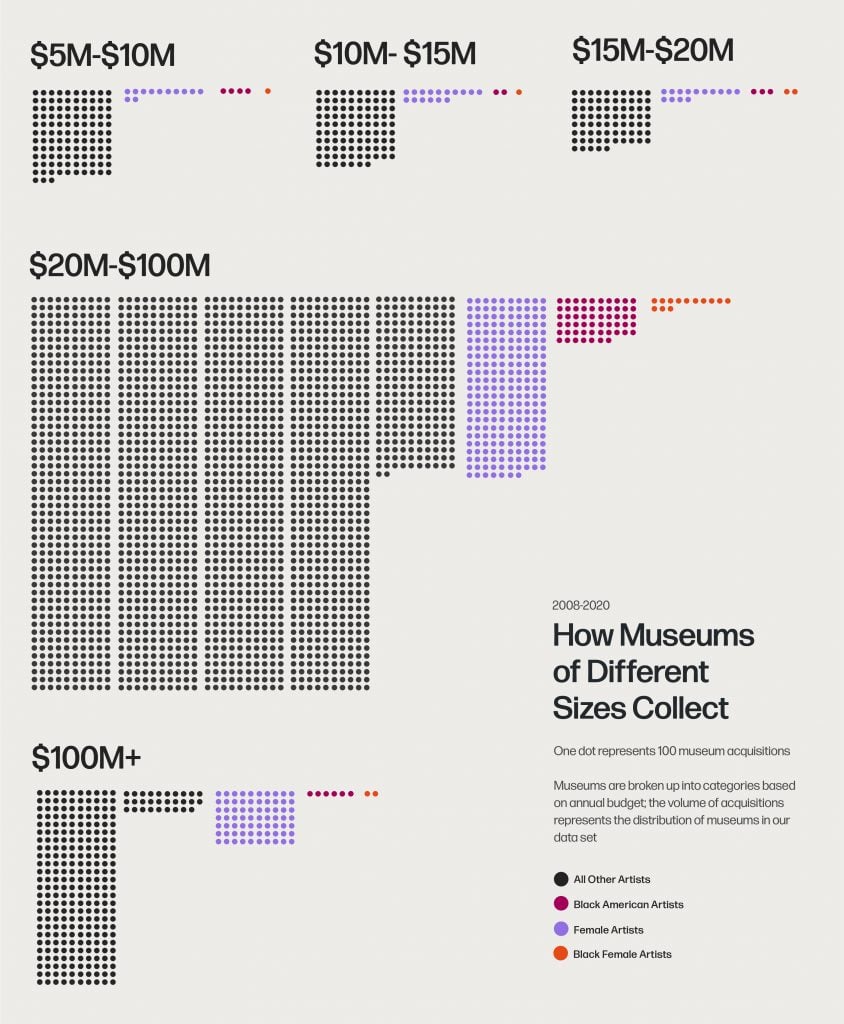
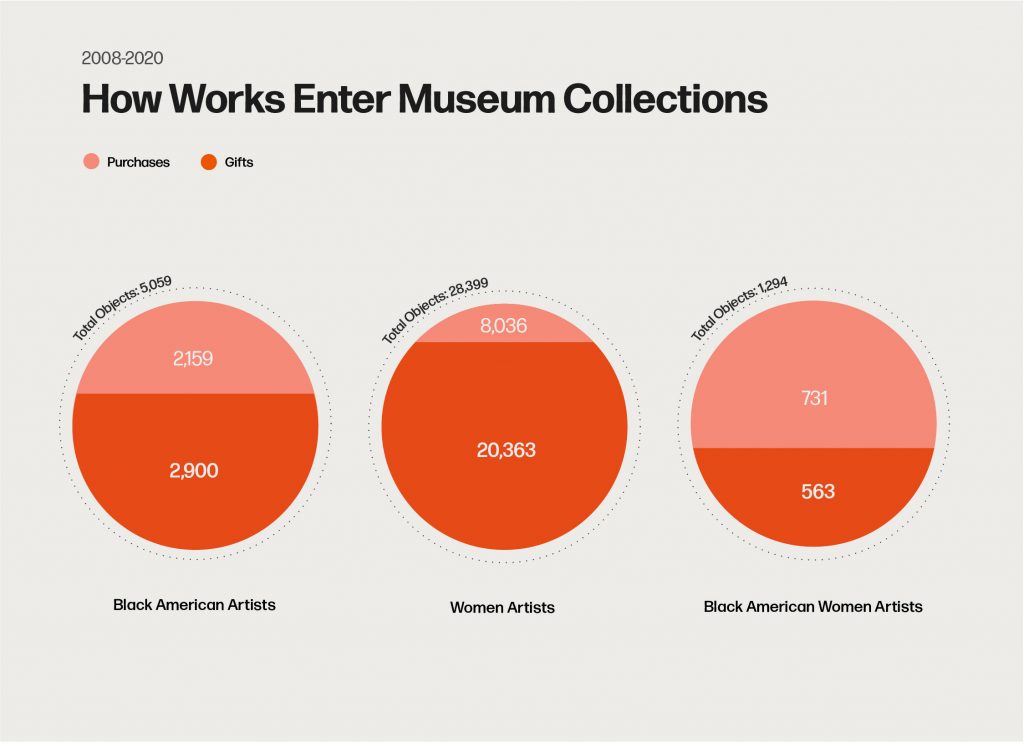
Graphic by Nehema Kariuki. Courtesy of the Burns Halperin Report 2022.
Graphic by Nehema Kariuki. Courtesy of the Burns Halperin Report 2022.
Graphic by Nehema Kariuki. Courtesy of the Burns Halperin Report 2022.
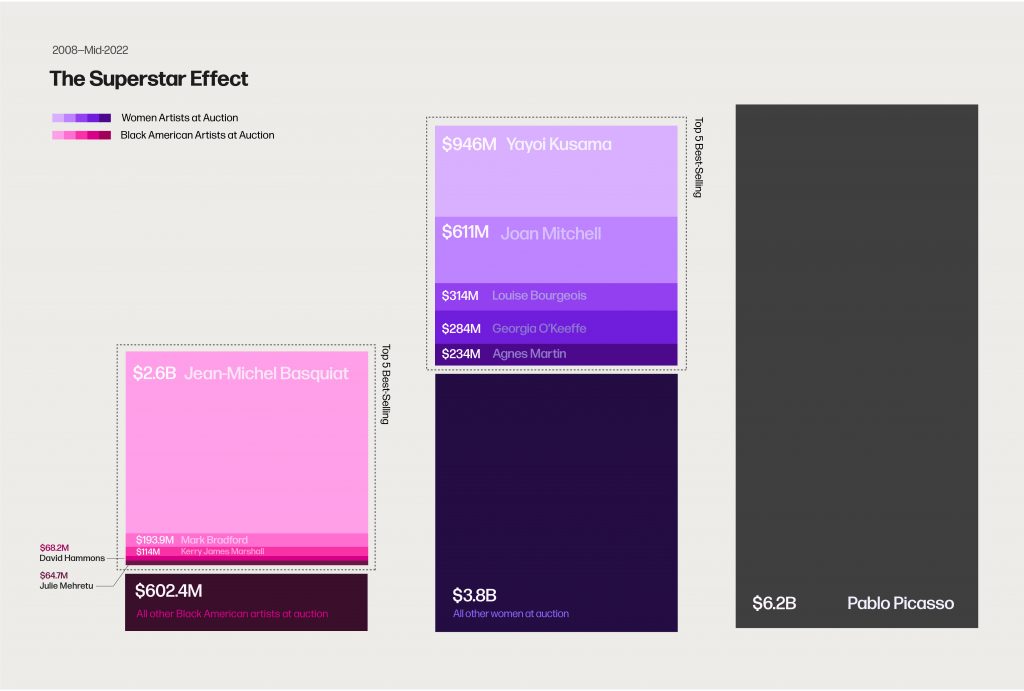
Graphic by Nehema Kariuki. Courtesy of the Burns Halperin Report 2022 and Artnet Analytics.
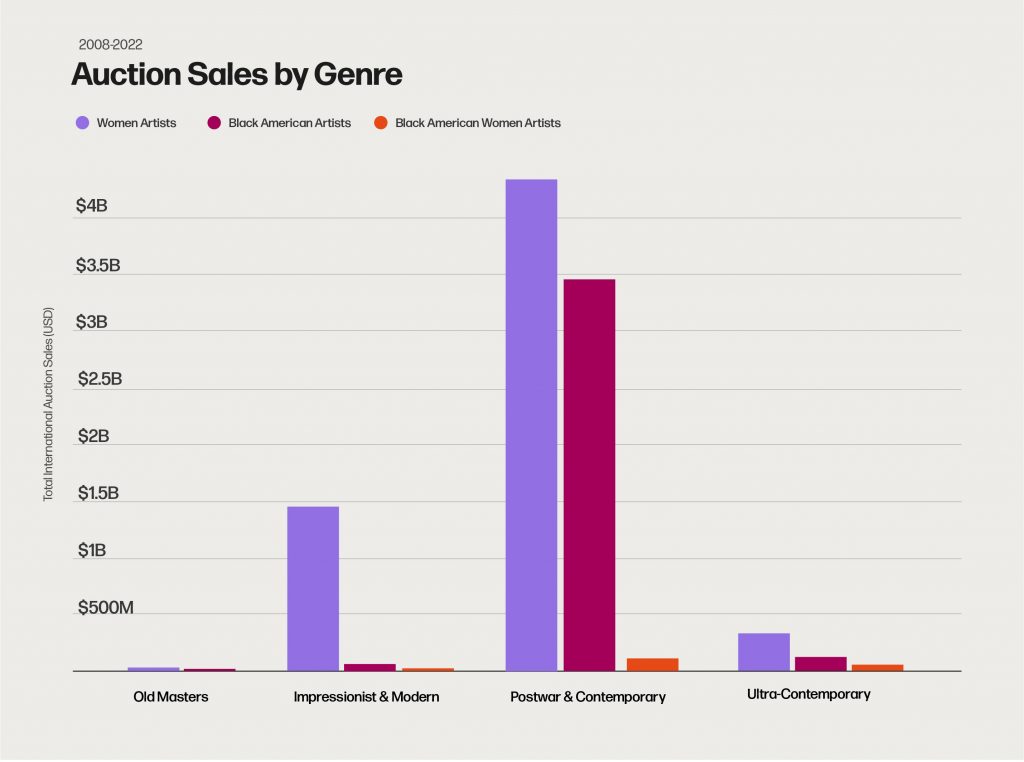
Graphic by Nehema Kariuki. Courtesy of the Burns Halperin Report 2022 and Artnet Analytics.
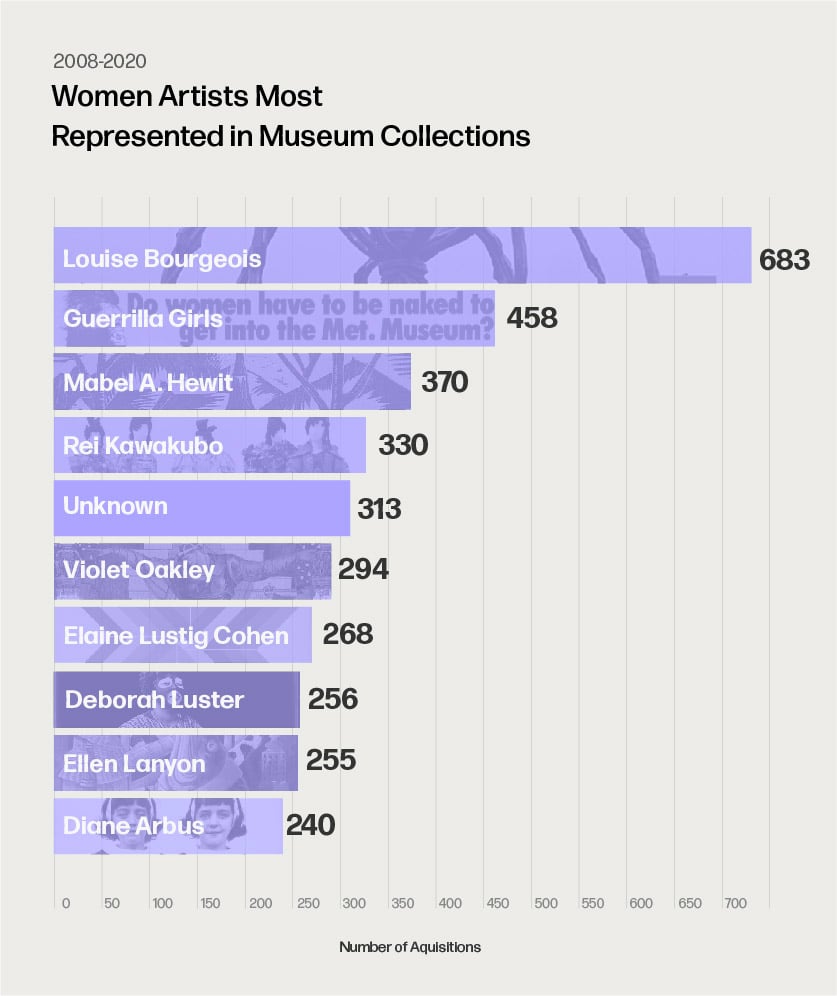
Graphic by Nehema Kariuki. Courtesy of the Burns Halperin Report 2022.
Graphic by Nehema Kariuki. Courtesy of the Burns Halperin Report 2022.
Graphic by Nehema Kariuki. Courtesy of the Burns Halperin Report 2022.
Graphic by Nehema Kariuki. Courtesy of the Burns Halperin Report 2022.